Read the liquidity map
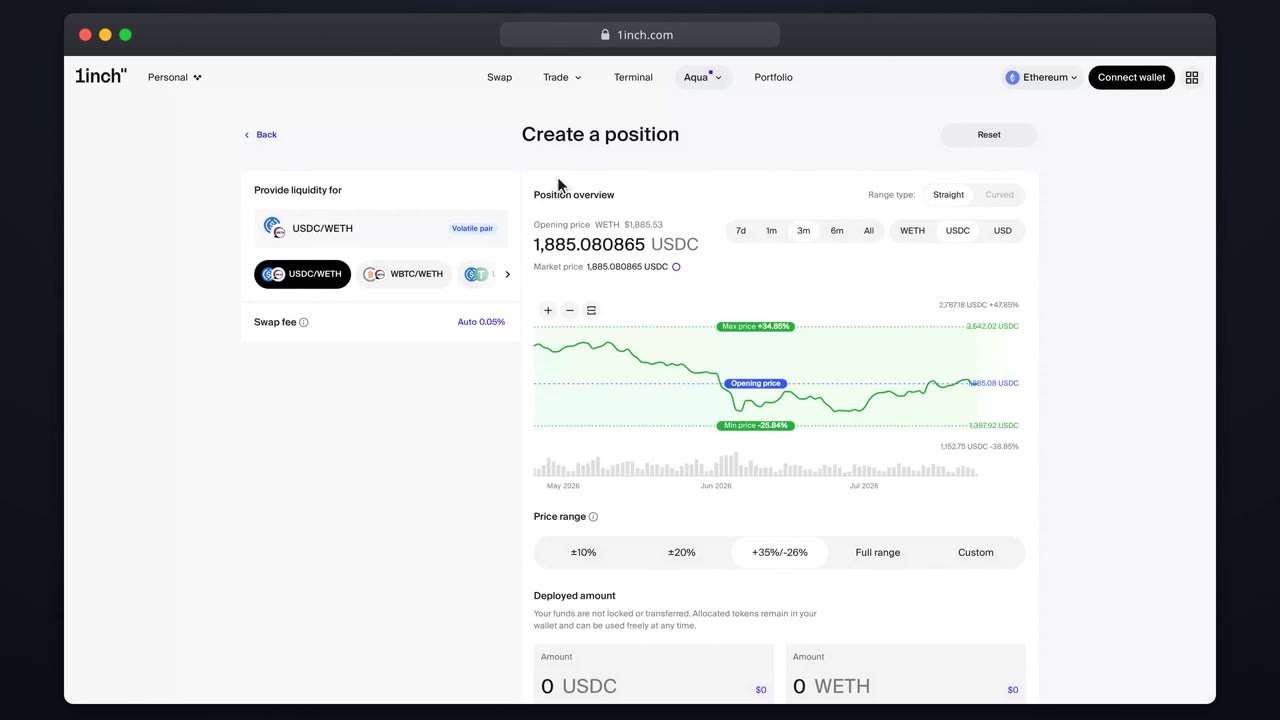
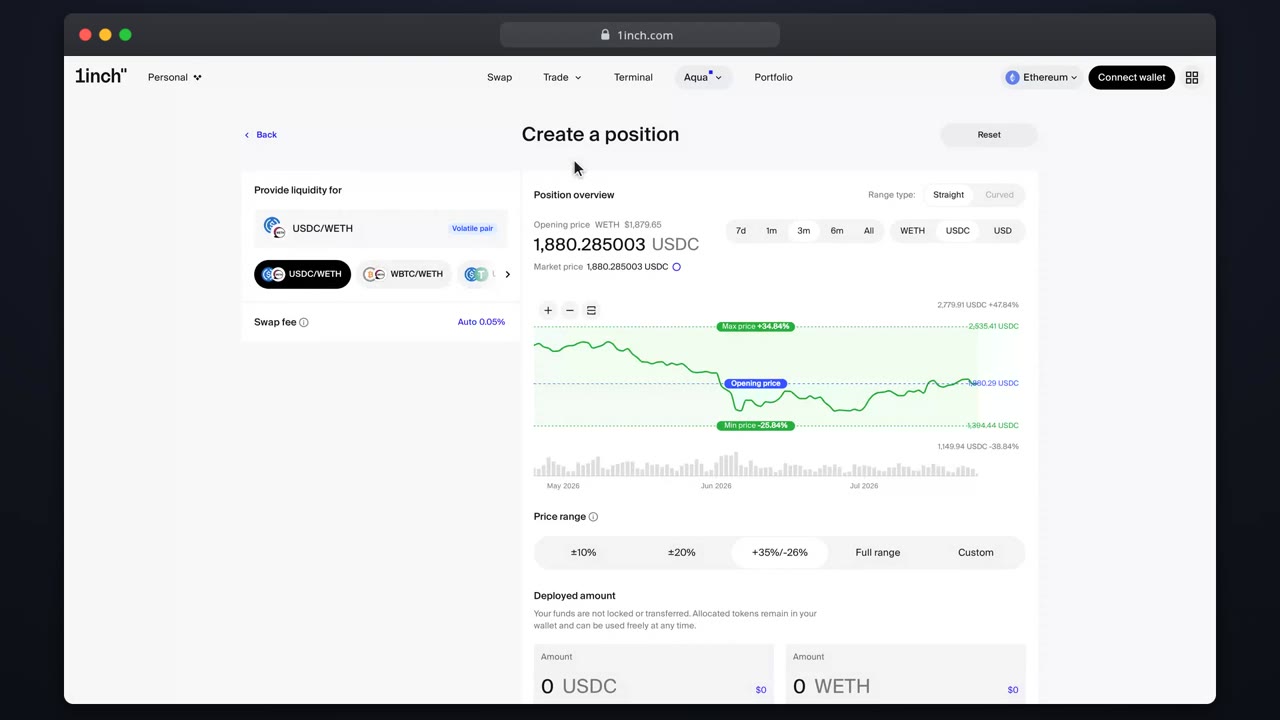
The liquidity map shows where a pair's liquidity actually sits. Place your range where it earns.
Chapters
- 0:00Opening the map
- 0:10Reading the axes
- 0:29Spotting gaps
- 0:39Applying to your range
What you'll learn
- What the map plots
- Finding underserved price bands
- Using the map while setting your range
Step by step
- 1
Open the map
From the builder, open the liquidity map for the selected pair.
- 2
Read the liquidity
Bars show how much liquidity quotes at each price band.
- 3
Find the gap
Underserved bands near market price are where a tight range tends to earn most.
- 4
Range accordingly
Set your edges against the map, then verify the allocation preview.
Related tutorials
This flow is automatically verified on every release.